

For the past fifteen years, comment sections have been judged on the handful of people who write in them. We focused on the wrong part of the audience.
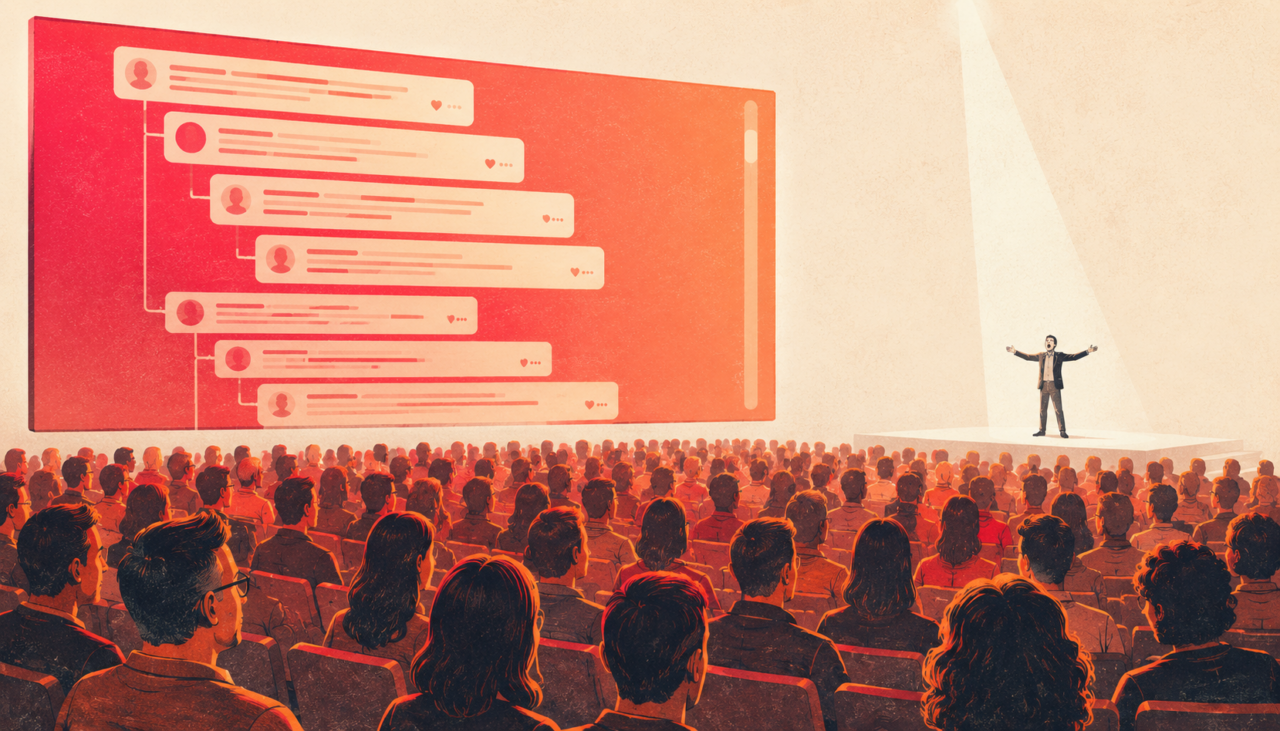
Under news articles, a large part of the audience stays completely invisible.
We readily notice the commenters — the trolls, the contrarians, the enthusiasts. We see them because they dare to post; and because of that, we ended up believing they were all there was. They aren’t. For every person who publishes a comment, around twenty others read the discussion without ever even logging in. Across large news communities running GraphComment, we measure this ratio at roughly 21 to 1 (May 2026). And it’s a floor.
This audience is quiet, overwhelmingly anonymous, missing from almost every dashboard. Yet it’s the most valuable part of your site. Here’s why — and how to finally make it visible.
The part of the audience you don’t see
Most tools measure what’s loud — comments — or what’s identified — registered users. We also try to measure the real audience.
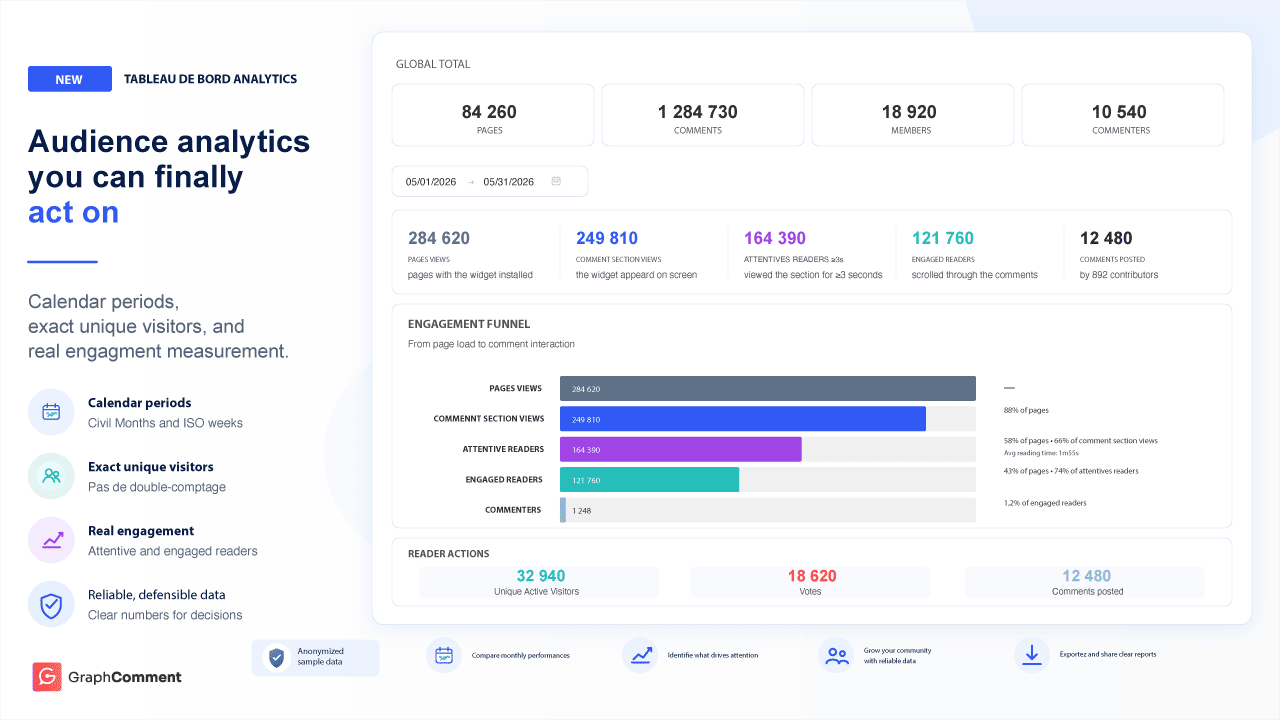
A like is visible. A comment is visible. A reader who carefully reads other people’s exchanges without ever joining in leaves no trace — unless you measure it. That’s what we do: every step of the journey is measured server-side, and we deduplicate IP addresses, by day and by month, to get a robust estimate of distinct visitors (an IP address is not a person: it’s a conservative indicator, not a head count).
The finding is unambiguous: nearly 99% of these readers never log in. Count only the accounts, and they disappear. Measure the real readers, and they make up the bulk of your audience.
It all sits inside a funnel that stays consistent, step by step — page view → comment section seen → attentive reader (3 seconds) → engaged reader → contributor — where each counter moves only once per session, and no step can ever show more people than the one before it.
More time than on the article itself
This audience doesn’t just pass through. An attentive reader often stays more than a minute, sometimes more than two, in the comment space alone. For part of your audience, the discussion isn’t a side note to the article: it’s a full part of the read.
They read this much because the space was built for them
If this audience reads so much, it’s no accident. Most comment modules stack messages and make reading a chore: as soon as the volume grows, you have to dig to find the exchanges worth your time. We did the opposite. Bubble Flow ranks messages by relevance and surfaces first the conversations the community values most, through a virtuous loop; even a thread with a huge number of contributions shows the replies readers care about most, first.
The distinction matters: we don’t just make posting easier, we work on the appeal of reading. That’s what turns a quick visit into a read, and a read into a habit.
Two audiences, two uses, one product
Reading and taking part aren’t the same need — and that’s where we differ. A reader looks first for the most interesting exchanges: Bubble Flow, sorted by relevance, is built for that. A commenter wants to follow the thread and reply without missing anything: they switch to chronological mode, messages one after another, in time order so nothing slips by.
Two modes in one product, for two opposite uses. Where most tools impose a single thread on everyone, we answer the reader’s needs and the contributor’s needs separately. That duality — more than any single metric — is why our communities read so much, and keep coming back.
When reading turns into revenue
This is where the topic stops being purely editorial and becomes commercial.
On a portal, a highly monetizable part of the inventory often sits below the article: the native recommendation and sponsored-content flow that unfolds after the text. That inventory only earns on one condition — that the reader scrolls down to it.
What’s the best reason to keep scrolling once the article is over? The discussion. Comments give readers a reason to go down the page — from one in five to nearly three in four depending on the title — taking the audience, on the way, past the inventory that earns the most.
The effect plays out on three levels. Volume: the longer a reader stays, the more ad slots can refresh and generate impressions per visit; depending on the setup, this can meaningfully lift revenue per session — on the order of 20 to 50% in some contexts, to be measured site by site. Viewability: under the IAB/MRC standard, a slot is only billable if it’s actually seen (at least half its pixels, at least one second), and a below-the-fold slot only gets there if the reader scrolls. Attention: the time an ad stays visible is now a pricing signal in programmatic. A discussion that holds attention means more inventory, better seen and better valued.
What you lose when you close comments
The corollary is plain. Closing your comments isn’t removing a feature: it’s removing one of the main reasons to keep reading. The audience that used to scroll down stops at the end of the article, and everything below it loses part of its audience.
The 2010s closed comments believing they were cutting a moderation cost. In reality they were cutting their own page scrolling, their own reading time, and their own inventory — without measuring it. The pendulum is in fact swinging back: newsrooms are reopening their comments — but reopening isn’t enough; you have to design the space for reading first. The difference, in 2026, is that you can put an exact number on what you lose, or what you regain.
Publishers who measure confirm it: the Financial Times reports that its readers who comment are up to 48 times more engaged than those who don’t; The State (McClatchy) measured that its active commenters read twice as many articles per visit and spend almost 16 more minutes on the site. The engagement around comments has real economic value — provided you design the space for reading, then measure it to steer it.
You’re measuring the wrong part of the audience
For fifteen years, the debate looked at whoever shouted the loudest. The value, though, sits mostly with the silent readers: those 21 readers behind every commenter. That’s exactly what GraphComment does: a comment space designed for reading first — Bubble Flow — and analytics that finally put the reading audience at the center. Design the space for them, measure them, and the comment section stops being a risk you tolerate and becomes one of the most engaging, most loyal and most monetizable spaces on your site.
So the real question isn’t whether to reopen comments. It’s how much longer you’ll keep steering your audience by the wrong metrics.
Sources
- Financial Times — commenters “up to 48 times more engaged”: Ben Whitelaw, “Newsrooms are taking comments seriously again,” Nieman Lab, Jan. 14, 2026. Exact quote: “The FT has also found that comment writers are up to 48 times more engaged than readers who don’t comment.” — https://www.niemanlab.org/2026/01/newsrooms-are-taking-comments-seriously-again/ (primary source linked by Nieman Lab: WAN-IFRA, May 2025, https://wan-ifra.org/2025/05/from-audience-to-community-high-engagement-strategies-from-the-ft-and-the-city/).
- The State / McClatchy — “twice as many articles, ~16 more minutes per visit”: “Comment sections aren’t dead (yet),” Digital Content Next, Mar. 5, 2020. Exact quote: “Active Coral commenters read twice as many stories on The State’s website per visit compared to other subscribers. These visitors spend almost 16 minutes longer on the site per visit as well.” — https://digitalcontentnext.org/blog/2020/03/05/comment-sections-arent-dead-yet/
- Ad viewability standard (50% of pixels for ≥1s, display) and the attention/effectiveness link: MRC/IAB standard; ad refresh (+20 to 50% revenue per session) and attention/time-in-view in programmatic — public ad-tech sources (Adelaide Metrics, Lumen Research, 2026 publisher guides).
- GraphComment data (May 2026): ~21:1 ratio (unique engaged comment readers / unique commenters, aggregated across several large news communities), attention time on the comment block, IP deduplication by day/month, “% read” rate, share of non-logged-in readers, Bubble Flow / chronological modes.