

An analytics dashboard built for media publishers
Media editors know the frustration of relying on vague metrics to shape their editorial strategy. Sliding time windows, inflated unique visitor counts, and engagement estimates that vary by user configuration make it difficult to trust the numbers. Decisions based on these flawed indicators can lead to misguided priorities.
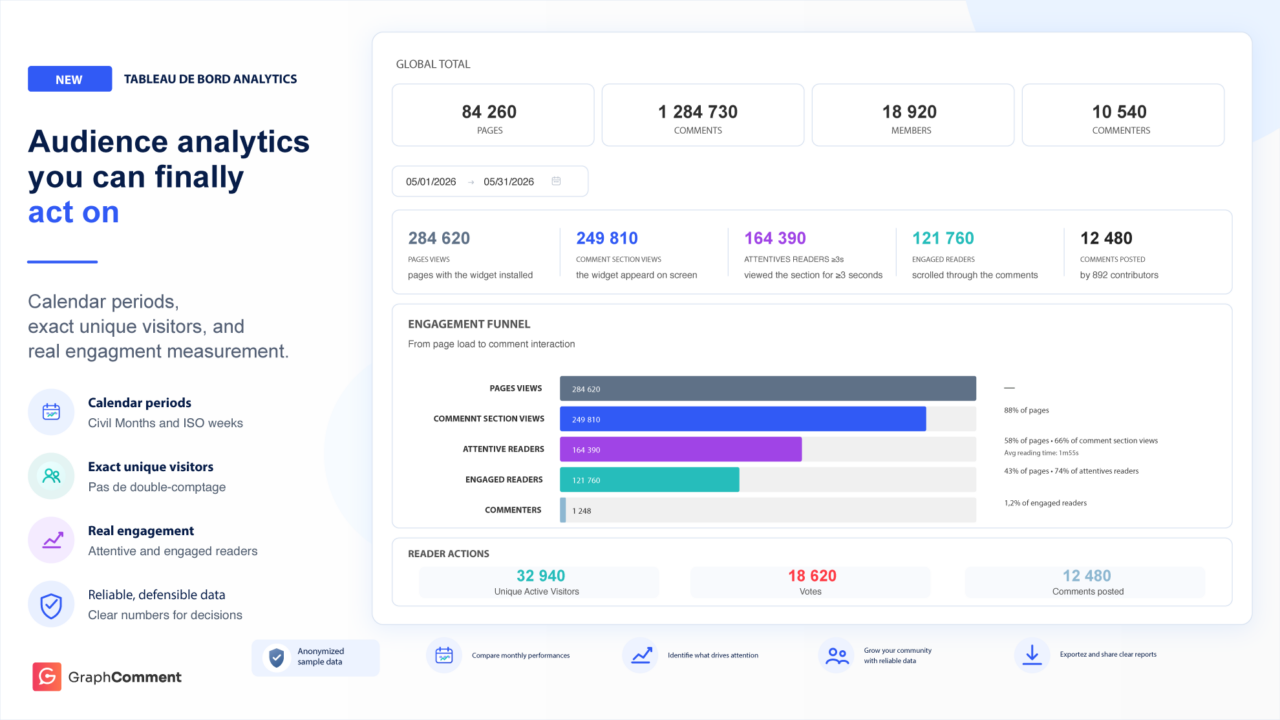
Our completely overhauled analytics dashboard addresses these challenges head-on. Now, publishers have a tool designed for their reality: clear calendar-based periods, accurate data, and a true measure of real community engagement.
What’s new
- Calendar-based periods: Choose precise analysis windows like ISO weeks or full months instead of rolling windows that don’t reflect your publishing rhythm.
- Exact unique visitor counts: No more double-counting the same visitor across days, which could inflate your figures by 1.5× to 5×. The data is now auditable and verifiable.
- Server-side real engagement metrics: No more browser-dependent declarations that depend on user configurations. Our five sensors (readers who actually read comments, reading time, etc.) measure what truly matters: the involvement of your community.
- 12-month trend view: A clear month-by-month table lets you track long-term trends, identify activity peaks, or spot quiet periods.
How to use it
Accessing the new features is simple:
- Log in to your GraphComment back-office.
- Go to the “Statistics” section in the sidebar.
- Use the new date picker to select your period (ISO week or calendar month).
- Explore real-time engagement data with filters by article, section, or author.
No need to juggle external tools or rely on rough estimates. Everything is centralized, real-time, and designed for publishers who want to master their audience.
Why this matters for your strategy
For a media editor, every decision depends on data. But those numbers must be reliable. Our revamp tackles three key challenges:
- Reliability: Exact, verifiable, and auditable data. No more doubts about your metrics’ accuracy.
- Precision: Periods aligned with your editorial calendar, enabling meaningful comparisons between months or weeks.
- Actionability: Metrics focused on real engagement, not estimates. Knowing how many readers truly interacted with your articles and comments changes everything.
Practically, this means:
- Optimizing your publishing frequency based on activity peaks.
- Identifying the content that drives the most community engagement and adapting your editorial line accordingly.
- Justifying your decisions to advertisers with transparent, auditable data.
Looking ahead
This revamp is just the beginning. We’re already working on inter-site comparisons, so media groups can benchmark their performance. Stay tuned.
Your community deserves better than vague numbers. Give them a voice—and give yourself the tools to understand it.
Access your new dashboard now in your GraphComment back-office.